Improve Sitecore 10 Performance in Azure PaaS (Part 1)


A lot of time when we developing on Sitecore, we won't notice the performance issue until we conduct a stress test to our solution.
The past few weeks, I went thru quite a number of solution to help improve the performance of a Sitecore 10 project that running on Azure PaaS. The project is required to conduct a load test with 1000 concurrent users.
Here are some tips to get Sitecore instance performing well under heavy load.
1. Redis Cache
Turning Affinity Cookie off to disable sticky sessions and remove dependency between user requests and processing CD instances.
 When sticky session behaviour is disabled ensure that an external session state provider is configured for Private and Shared session storage. https://doc.sitecore.com/en/developers/100/platform-administration-and-architecture/walkthrough--configuring-a-private-session-state-database-using-the-redis-provider.html
Sitecore have some recommended timeout settings for Redis Cache that can help if you are getting timeouts.
<configuration xmlns:patch="http://www.sitecore.net/xmlconfig/" xmlns:set="http://www.sitecore.net/xmlconfig/set/" xmlns:role="http://www.sitecore.net/xmlconfig/role/">
    <sitecore role:require="ContentDelivery">
        <tracking>
            <sharedSessionState defaultProvider="redis">
                <providers>
                    <clear />
                    <add name="redis" type="Sitecore.SessionProvider.Redis.RedisSessionStateProvider"
               connectionString="redis.sessions" applicationName="shared" pollingInterval="60" operationTimeoutInMilliseconds="5000"
               retryTimeoutInMilliseconds="16000" connectionTimeoutInmilliseconds="3000" pollingMaxExpiredSessionsPerSecond="20"/>
                </providers>
            </sharedSessionState>
        </tracking>
    </sitecore>
</configuration>
NOTE: The final values must be tuned per-solution as a result of a load testing. https://support.sitecore.com/kb?id=kb_article_view&sysparm_article=KB0464570
Please make sure Redis is not the bottleneck before move on to next topic.
2. Enable cache key indexing
Cache key indexing can significantly reduce the time it takes to perform operations on a large cache, and is particularly useful in large solutions where items are frequently renamed, moved, copied, and deleted.
<?xml version="1.0" encoding="utf-8"?>
<configuration xmlns:patch="http://www.sitecore.net/xmlconfig/" xmlns:role="http://www.sitecore.net/xmlconfig/role/">
    <sitecore role:require="ContentDelivery">
        <settings>
            <setting name="Caching.CacheKeyIndexingEnabled.AccessResultCache" value="true" />
            <setting name="Caching.CacheKeyIndexingEnabled.ItemCache" value="true" />
            <setting name="Caching.CacheKeyIndexingEnabled.ItemPathsCache" value="true" />
            <setting name="Caching.CacheKeyIndexingEnabled.PathCache" value="true" />
        </settings>
    </sitecore>
</configuration>
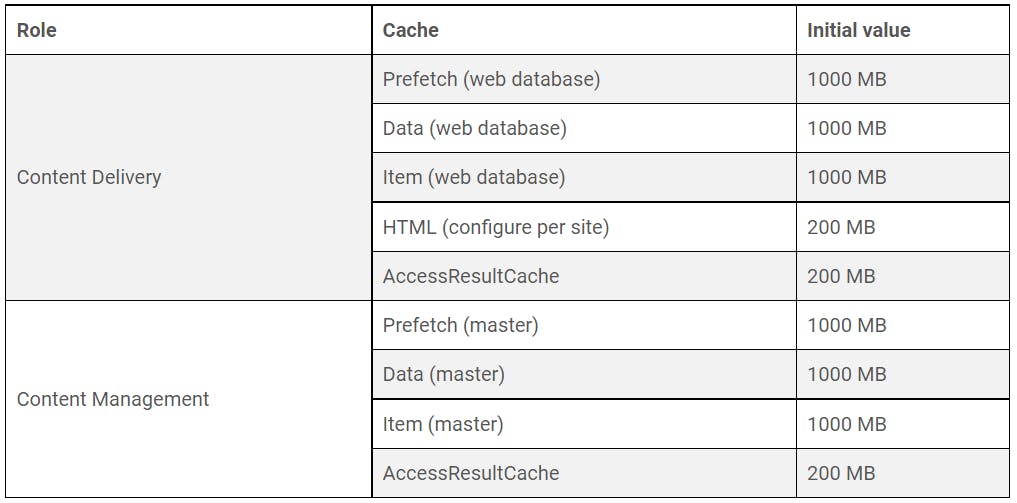
3. Set initial cache values
Use the following table as a starting point for database and HTML output cache values. Set initial cache values before performing cache tuning procedures.
<configuration xmlns:patch="http://www.sitecore.net/xmlconfig/" xmlns:set="http://www.sitecore.net/xmlconfig/set/" xmlns:role="http://www.sitecore.net/xmlconfig/role/">
    <sitecore>
        <settings>
            <setting name="Caching.AccessResultCacheSize" set:value="200MB"/>
        </settings>
        <databases>
            <database id="master" role:require="ContentManagement or Standalone">
                <cacheSizes>
                    <data>1000MB</data>
                    <items>1000MB</items>
                </cacheSizes>
                <dataProviders>
                    <dataProvider param1="$(id)">
                        <prefetch hint="raw:AddPrefetch">
                            <cacheSize>1000MB</cacheSize>
                        </prefetch>
                    </dataProvider>
                </dataProviders>
            </database>
            <database id="web" role:require="ContentDelivery or Standalone">
                <cacheSizes>
                    <data>1000MB</data>
                    <items>1000MB</items>
                </cacheSizes>
                <dataProviders>
                    <dataProvider param1="$(id)">
                        <prefetch hint="raw:AddPrefetch">
                            <cacheSize>1000MB</cacheSize>
                        </prefetch>
                    </dataProvider>
                </dataProviders>
            </database>
        </databases>
    </sitecore>
</configuration>
4. Use Sitecore’s HTML caching
You can improve the load time of your SXA web pages by setting the caching options for the SXA renderings. The SXA HTML cache minimizes the number of times Sitecore processes renderings. This is very important, especially if you have renderings that iterate over a large amount of items.
To set the caching of a rendering on the site level:
Navigate to
sitecore/<tenant>/<site>/Presentation/Cache Settingsand on the Home tab, clickComponent Cache Settings.Enter a name for the setting and click OK.
In the Select Items dialog box, navigate to
Layout/Renderings/Feature/Experience Accelerator, click the renderings for which you want this setting to apply, and use the arrow to move them to the Selected field.In the
Cachingsection, select the caching options: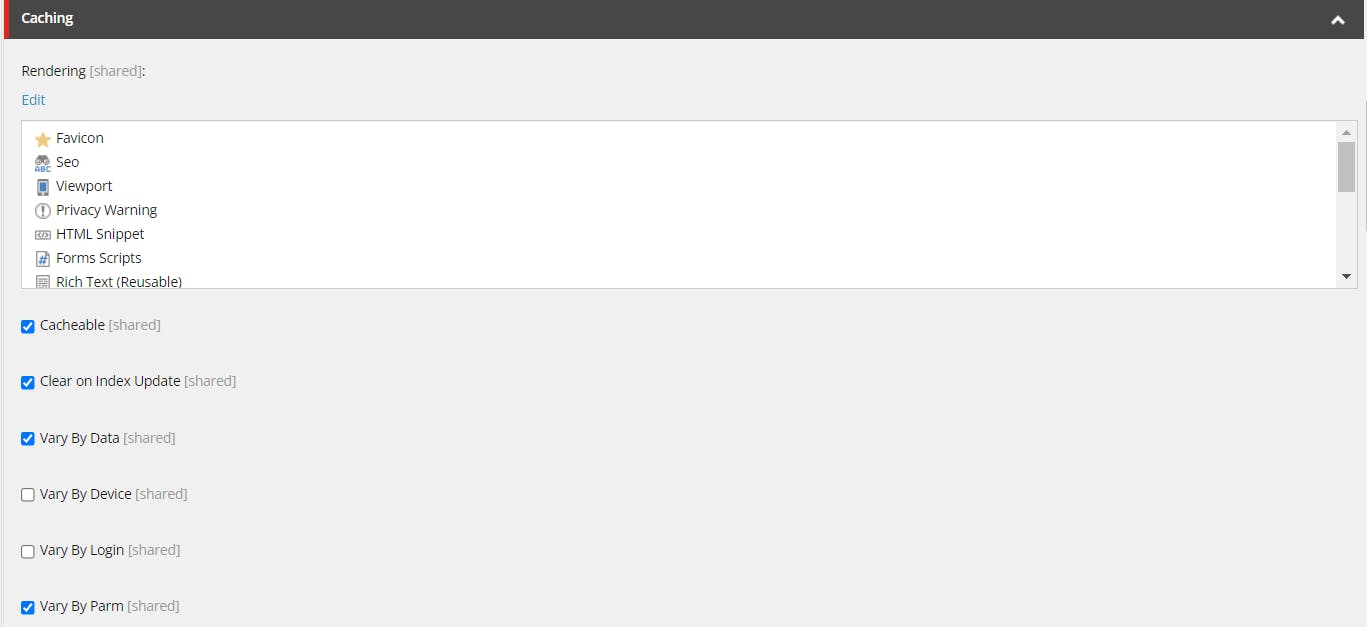
- Save and Publish it.
5. Disable Performance Counters
Sitecore Performance Counters should be disabled. It should be a best practice to at least run the Performance Counters enabled one time to make sure everything is installed and ready to run This is helpful in the event that you do end up needing them. It will also help to reduce the I/O on Azure PaaS
<setting name="Counters.Enabled" value="false" />
6. Disable "fcnMode" for ASP.Net
When FcnMode feature is enabled, it restarts the Web App when certain files are changed (.dll, .config). In certain cases, unexpected App Pool restarts might be attributed to this feature being enabled. For example, some challenges have been observed when application logic creates rapid file modifications or there is a directory structure with many subdirectories that each requires separate FcnMode monitoring. Implementations may choose to disable the 'FcnMode' as a precaution.
To turn off FCN:
Add fcnMode="Disabled" to the httpRuntime section in the web.config file:
<system.webServer>
        <system.web>

            <!-- To minimize the risk of an Overwhelming File Change Notifications error leading to application pool recycling, turn off the File Change Notification (FCN) setting. -->
            <httpRuntime executionTimeout="110" fcnMode="Disabled" xdt:Transform="Replace" />
        </system.web>
</system.webServer>
This is a tuning suggestion from https://doc.sitecore.com/en/developers/100/managed-cloud/recommendations--sitecore-tuning-in-azure.html .
Upcoming
Part 2, I will discuss more on App Service related issue on Azure PaaS.
https://edwenkerk.hashnode.dev/improve-sitecore-10-performance-in-azure-paas-part-2
Debug Tips
1. Configure Application Insights to display Application Map
When Sitecore is deployed to Microsoft Azure App Service, it is integrated with the Application Insights service by default. In order to optimize resources consumption, Sitecore does not collect "dependency" telemetry events, which record information about outgoing HTTP and SQL connections from a Sitecore XP instance. https://support.sitecore.com/kb?id=kb_article_view&sysparm_article=KB0201177
Note: Enabling dependency collector will significantly increase telemetry consumption in the Application Insights service and should only be used for diagnostic purposes.
2. App Service Diagnostics – Profiling an ASP.NET Web App on Azure App Service
Profiler tool helps in collecting an on-demand trace that lets you identify the underlying .NET exceptions, time taken in the various request processing pipeline stages and even lets you drill down into exact methods within the application code that are taking time. It is extremely useful in situations where the problem is happening right now and you want to collect some data to identify the root cause of the issue. https://azure.github.io/AppService/2018/06/06/App-Service-Diagnostics-Profiling-an-ASP.NET-Web-App-on-Azure-App-Service.html